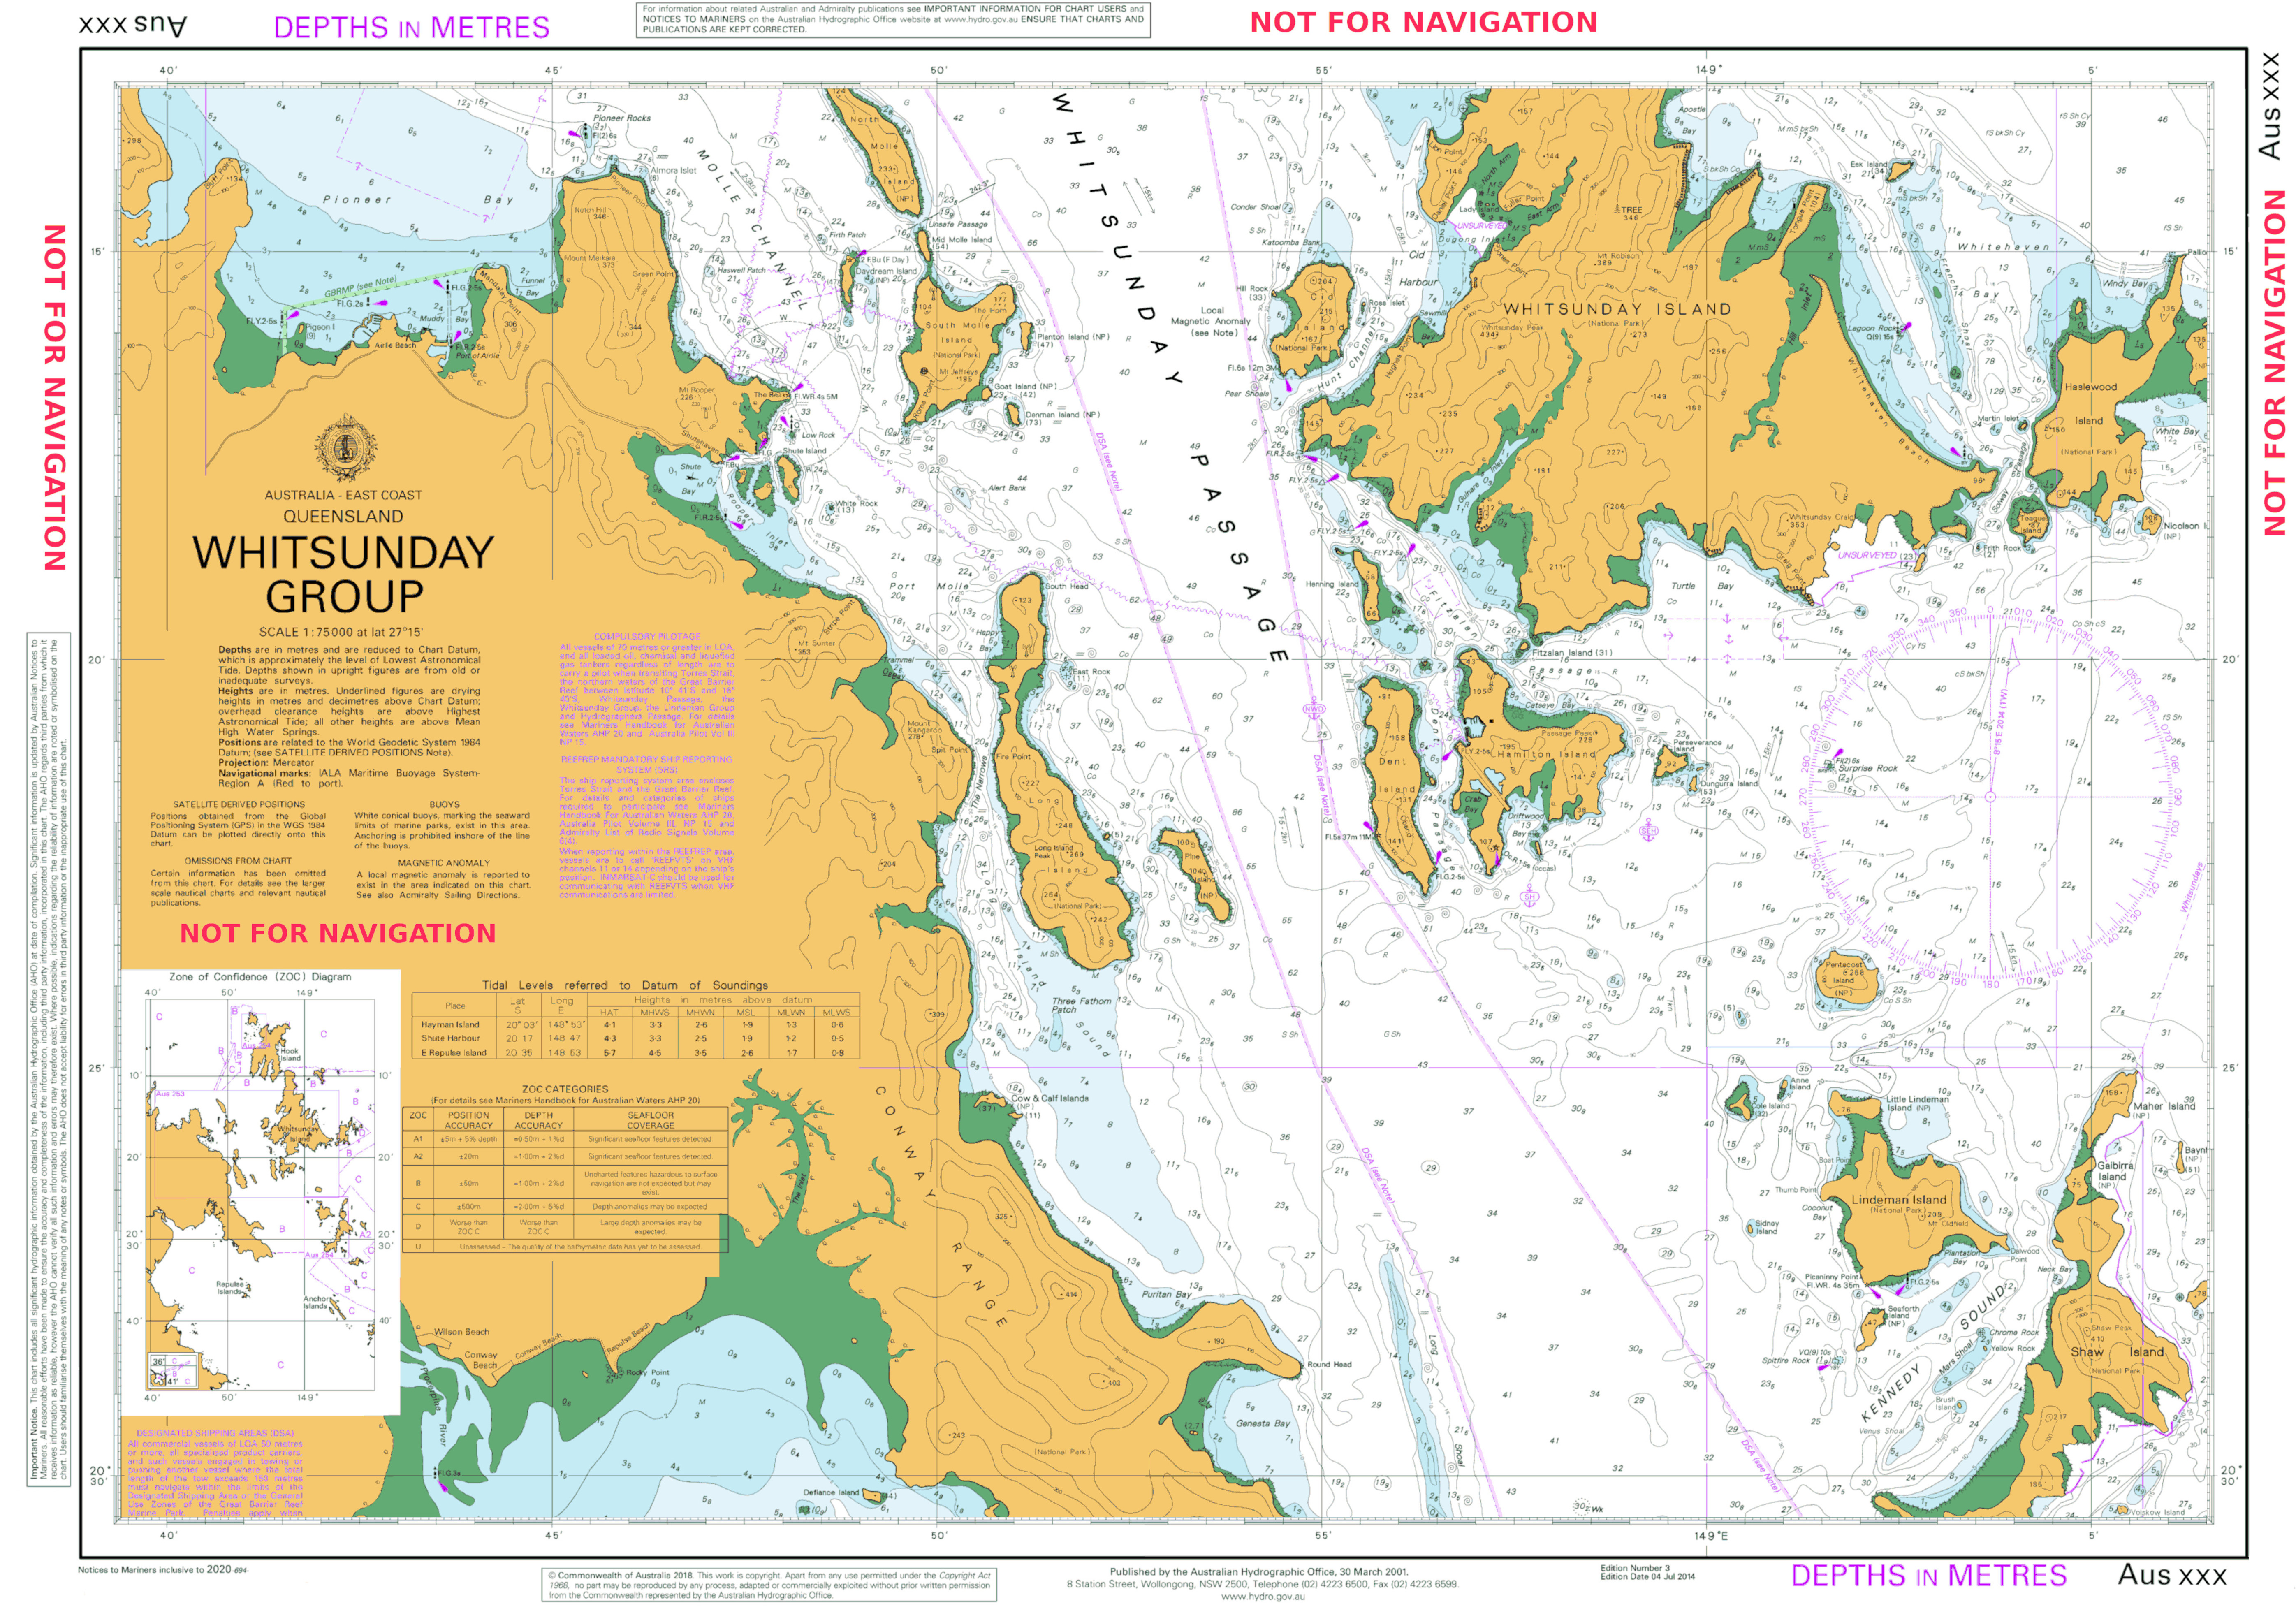
The most essential part of navigation is the navigation chart, the detailed display of all essential navigation information including navigation marks and aids, land masses, water depth, and hazards. For most people starting to learn navigation now, they would be most familiar with electronic charts on a small chart plotter. However, did you know that the charts in your chart plotter are not official charts, and even if you buy the memory card with the latest charts, there is no way looking at the chart to confirm that the are up to date.

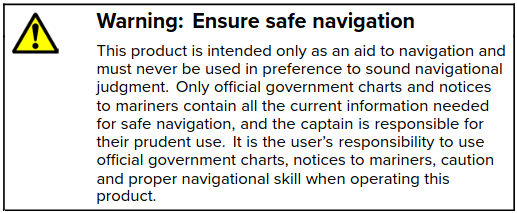
In Australia, it is the Hydrographic office that is the ultimate Authority over official navigation charts, and they have issued an official warning regarding the use of non-official charts. To read the warning, press the button below..
"Only national hydrographic offices may produce charts referred to as ‘ENC’."
"Official charts are the result of months of painstaking work to ensure they are as accurate as possible using the information available."
"In contrast, a number of companies are licensed to reproduce content from the official charts for use in smaller chart plotters."
"These ‘unofficial’ charts are not warranted as suitable for safe navigation by either the Commonwealth or the manufacturer."
"While the manufacturer may claim they contain additional data to meet specific purposes, or claim regular updates, mariner and AHO experience has repeatedly found these may also contain major cartographic errors (such as missing reefs) or delays of up to three years for the inclusion of critical new information. If used, they should be used with caution, and only after referring to the official charts."
If you were to open the user manual for a chartplotter, you will see that manufacturers clearly state that their equipment is only an aid to navigation and to be used along side official charts and notices to mariners. Most even provide this warning as soon as you switch the chart plotter on.

Does this mean that you should not use an electronic chart plotter. Of course not. A chart plotter is a fantastic and convenient tool, but you should always be aware that they may not always be accurate, and if possible, check it against an official chart.
There are several different forms of electronic charts, and it is worth keeping these in mind if you ever come across them.
Raster charts are scanned bitmap images of paper charts
They are scanned at high resolution to maximise detail, and converted to a digital representation.
The symbols, colour and information presented on the raster chart are
identical to paper charts.
They are widely available and provide a cost effective way to convert
information into an electronic format.
Raster charts do have some drawbacks.
Due to the nature of their digitisation, they carry along with them any
inherent errors in the paper charts, and any errors that may have been
introduced through the scanning process.

Raster charts are a picture image and carry no additional data that may be queried by the user on an electronic chart plotter. You can not select a navigation aid to find out more information. What you see is what you get.
Raster charts were widely used when electronic chart plotting systems were first introduced as it was the quickest way to establish the library, however they have gradually been replaced by vector charts. Raster charts now exist only for remote areas that have not been surveyed in a long time. If you do come across a raster chart in your electronic device, be careful as the survey data used to make the chart may be very old, and things like sandbars and shallow spots may have shifted.
Vector charts are constructed of lines, points or areas which not only provide
a graphic representation of charted features, but also include an
associated data base.
The database provides 'layers' of information on the electronic chart
which allow the user to manually or automatically query a specific area
for additional information.
Chart plotters have a facility to zoom in on a vector chart and get more
information, whereas when zooming in on a raster chart the same image
just gets bigger.

The layers of data on a vector chart can be read by an ECDIS and
depending on the configuration, Alarm parameters can be set to warn of
approaching hazards such as shoal water or an underwater obstruction.
Individual points or areas on the vector chart may be queried by the
user such as navigation marks, sounding data in a chosen location,
anchorage information, traffic schemes etc.
Official ENC charts can be displayed using an official chart viewer that you can run on a computer. Larger commercial vessels use equipment known as an ECDIS. These are very expensive and are not really suitable for a recreational vessel, but they are purposefully designed for marine navigation.
This is the most important question to deal with. Electronic charts have one major drawback on a boat. They are reliant on your electrical supply, and may fault. Everyone has experience with electronics failing whtn you need them the most, and marine electronics are no different. In addition, a lot of boat builders are now placing the chart plotters in very inconvenient places that are not very usefull.
But all is not lost.
Although traditional paper charts are being phased out, they are being replaced with the concept of print on demand. This means that you will be able to go online, or to the local chart shop, and get the latest charts printed out for the specific areas that you need. These print outs will contain all the latest updates and be supported by the hydrographic office as official charts. As a result, you will still need the traditional navigation skills to fall back on if your electronics ever start to have issues.
